

How to Monitor Server Uptime Using External Ping Tools: The Complete Engineering Guide
Welcome to thehostreviews.com—your premier authoritative destination for cloud infrastructure evaluations, system administration tutorials, and high-availability architecture guides spanning major technical hubs from New York and San Francisco to Texas, California, and Washington.
Introduction: Why Internal Monitoring Is Not Enough
When managing a Virtual Private Server (VPS) or a multi-node cloud deployment, knowing the health status of your infrastructure is paramount. A common mistake made by junior developers and system administrators is relying exclusively on internal monitoring services—scripts or applications running inside the target server itself.
If your server experiences a catastrophic kernel panic, a complete power failure in the data center, a network routing black hole, or an unmitigated out-of-memory (OOM) crash, internal monitoring tools go down with the server. They cannot send out alerts because they are dead.
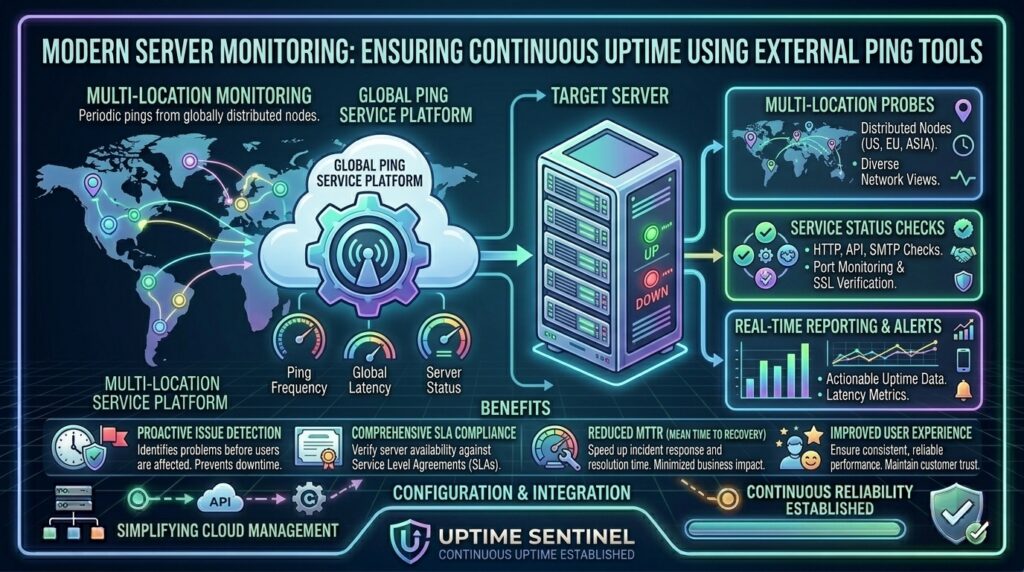
This is why external uptime monitoring using external ping tools is an absolute requirement for production environments. External monitors sit completely outside your network perimeter, probing your infrastructure from independent global data centers.
Whether you operate e-commerce applications in Texas, SaaS platforms in San Francisco, or media servers in New York, this comprehensive guide will teach you how to architect robust, external ping monitoring to guarantee maximum uptime.
Part 1: How External Ping Tools Work
An external ping monitor functions as an independent automated watchdog. It operates on a continuous loop, checking your infrastructure at regular intervals (ranging from every 30 seconds to 5 minutes).
The Core Probing Protocols:
- HTTP/HTTPS GET Checks: The tool sends an actual web request to your URL and checks for a
200 OKstatus response code. It can also scan for specific keyword text to ensure your application isn’t throwing a database connection error behind a generic page. - ICMP Ping (Echo Request): Sends standard network packets to your server’s IP address to test raw network reachability and packet loss.
- TCP Port Probing: Verifies if specific ports are open and listening (e.g., Port
443for HTTPS, Port22for SSH, or Port3306for MySQL). - SSL Certificate Expiry Tracking: External monitors track the remaining validity days of your SSL/TLS certificates, alerting you before encryption expires and triggers browser security warnings.
Part 2: Top External Uptime Monitoring Tools Compared
Choosing the right external monitoring tool depends on your budget, scaling requirements, and alerting preferences. Here are the industry-leading solutions:
| Monitoring Tool | Best Suited For | Key Features & Advantages |
| UptimeRobot | Budget-friendly basic monitoring | Generous free tier (up to 50 monitors), simple UI, email/webhook alerts. |
| Better Stack | Advanced incident response & logs | Combines uptime checks with centralized logging, status pages, and on-call escalation. |
| Hyperping | Predictable flat-rate team monitoring | 30-second check intervals, built-in status pages, and on-call scheduling without per-user fees. |
| Uptime Kuma | Self-hosted open-source control | Runs on a Docker container, supports 20+ monitor types, completely free with unlimited checks. |
| Pingdom | Enterprise synthetic and RUM checks | Real User Monitoring (RUM), multi-location probing, transaction performance tracking. |
Part 3: Step-by-Step Guide — Setting Up an External Monitor
Let’s walk through the exact process of setting up a robust external ping monitor using a standard SaaS tool or a self-hosted instance like Uptime Kuma.
Step 1: Define Your Critical Endpoints
Never monitor just your root domain homepage. Create distinct monitors for your critical infrastructure layers:
- The Frontend URL:
[https://thehostreviews.com](https://thehostreviews.com)(Checking for HTTP 200 and keyword presence). - The API Endpoint:
[https://api.thehostreviews.com/health](https://api.thehostreviews.com/health)(Ensuring database and backend routes are responsive). - The SSH Port: TCP Port
22or your custom SSH port to verify network availability.
Step 2: Configure Global Multi-Location Probing
To prevent false alarms caused by localized network glitches between a single monitoring data center and your host, configure your tool to check your server from at least three distinct geographic regions (e.g., North America, Europe, and Asia-Pacific). An alert should only trigger if multiple global locations report a failure simultaneously.
Step 3: Set Appropriate Check Intervals and Thresholds
- Frequency: For production web applications, set your check intervals to 1 to 3 minutes. Setting checks below 30 seconds can trigger unnecessary false positives due to micro-network latency spikes.
- Sensitivity Thresholds: Configure the monitor to require 2 consecutive failed checks before dispatching an alert. This filters out transient packet drops.
Part 4: Configuring Multi-Channel Incident Alerting
Getting an email alert five hours after your server crashes is useless. Modern external monitoring tools allow you to route alerts through instant communication channels:
- PagerDuty / Opsgenie: For critical infrastructure that requires waking up on-call engineers via phone call or SMS escalation policies.
- Slack / Microsoft Teams / Discord Webhooks: Instantly broadcast downtime alerts directly to a dedicated
#devops-alertschannel in your workspace. - Custom Webhooks: Programmatically trigger automated scripts (such as GitHub Actions or serverless functions) to attempt automated container restarts or DNS failovers when downtime is confirmed.
Part 5: Setting Up Public Status Pages
Transparency builds trust with your users. Most professional external monitoring tools include or integrate with public status pages (e.g., Instatus or built-in status pages from Hyperping and Better Stack).
- Why Use a Status Page: When customers experience issues accessing your site, a live public status page stops your support inbox from flooding with duplicate tickets.
- Best Practices: Embed your status page on a subdomain (
status.thehostreviews.com), link it in your website footer, and configure it to automatically update users in real-time when an outage is detected or resolved.
Part 6: Best Practices for Advanced Uptime Monitoring
- Monitor Cron Jobs and Background Tasks: Traditional ping monitors only check incoming HTTP requests. Use heartbeat monitors (like Cronitor) to track scheduled background scripts, database backups, and cron jobs. If a background worker fails to send a “pulse” signal on schedule, an alert fires.
- Test Your Alert Routes Monthly: Schedule a routine test by temporarily disabling a non-critical service or blocking an IP to verify that your Slack and SMS alert pathways are functioning properly.
- Monitor SSL Certificate Expiry: Ensure your uptime tool is actively tracking SSL expiration dates with a 30-day warning threshold to prevent sudden certificate trust errors.
Part 7: Frequently Asked Questions (FAQ)
1. What is an external ping monitor?
An external ping monitor is an independent third-party service that checks whether your server or website is online from servers located outside your own network infrastructure.
2. Why is internal server monitoring not enough?
If your server crashes completely, loses power, or suffers a kernel panic, internal monitoring tools die with it and cannot send out alerts. External monitors remain online and detect the failure instantly.
3. What is the difference between ICMP Ping and HTTP monitoring?
An ICMP ping checks raw network IP reachability, whereas an HTTP monitor tests whether your web server software is actively processing web pages and returning correct status codes.
4. How often should external monitoring tools check my website?
For standard production websites, check intervals of 1 to 3 minutes provide a strong balance between rapid incident detection and avoiding unnecessary false positives.
5. What are false positives in uptime monitoring?
A false positive occurs when an external monitor reports your site is down due to a temporary routing glitch between the monitor’s specific data center and your host, even though your site is accessible to the rest of the world. Multi-location verification solves this.
6. Can I host my own external monitoring tool for free?
Yes! Tools like Uptime Kuma can be self-hosted on a separate, secondary VPS or a local machine using Docker, giving you unlimited free monitors and complete data privacy.
7. What is a heartbeat monitor?
A heartbeat monitor expects your server or background script to ping it at regular intervals (e.g., every night during a database backup). If the pulse stops arriving, it alerts you that a background task has failed.
8. How do public status pages help my business?
Public status pages communicate downtime transparently to your customers, reducing support ticket volume and maintaining user trust during unexpected infrastructure outages.
9. Do external monitoring tools impact server performance?
No. External monitors send lightweight HTTP requests or ping packets every few minutes, consuming negligible server bandwidth and zero server resources.
10. Which external monitoring tool is best for beginners?
Tools like UptimeRobot (for free basic checks) or Hyperping / Better Stack (for polished team alerts and status pages) are ideal choices for beginners and professionals alike.
Conclusion
Setting up external ping monitoring is a mandatory step in maintaining professional, high-availability web infrastructure. By decoupling your monitoring from your primary hosting environment and configuring multi-location checks with instant team alerts, you ensure that downtime is addressed before your users even notice.