

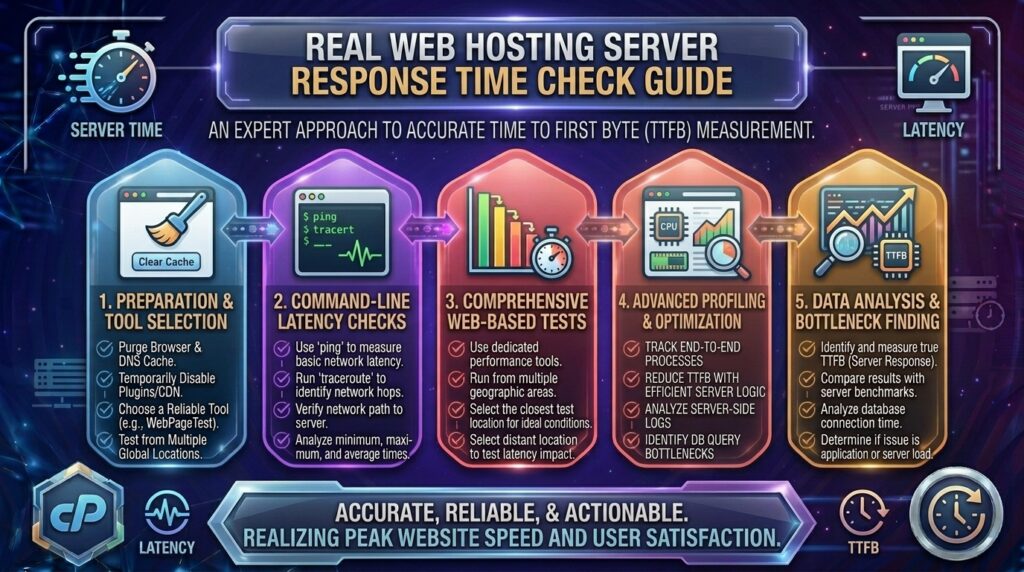
How to Check Real Web Hosting Server Response Time: The Ultimate Performance Audit Guide for 2026
When launching or scaling a digital asset for target audiences across high-demand tech hubs like Texas, New York, California, Washington, and San Francisco, minimizing infrastructure friction is a primary operational objective. Budget-conscious site owners, entrepreneurs, and digital agencies frequently select affordable web hosting plans to keep overhead low. However, a major pitfall in the budget hosting market is relying entirely on marketing promises rather than hard empirical data.
A hosting provider may advertise blazing-fast speeds, but how do you know what your server is actually doing under real-world conditions?
Measuring your real web hosting server response time—technically quantified as Time to First Byte (TTFB)—is the single most critical diagnostic procedure you can perform. If your server is slow to respond, your entire application stack stalls, your Core Web Vitals plummet, and your search engine optimization (SEO) rankings suffer.
This comprehensive, expert-level guide explores how to accurately test, analyze, and optimize your web hosting server response times, providing actionable tips and diagnostic workflows designed to rank at the top of Google search.
What Is Server Response Time (TTFB) and Why Does It Matter?
Before testing your server, it is essential to understand what server response time actually measures.
Time to First Byte (TTFB) is the exact duration elapsed from the moment a client browser (or Googlebot) issues an HTTP request to your web server until the moment the server sends back the very first byte of data.
The TTFB Breakdown:
- DNS Lookup: Resolving your domain name (
thehostreviews.com) into an IP address. - TCP Handshake & SSL Negotiation: Establishing a secure, encrypted connection with the remote web server.
- Server Processing Time: The time it takes for your web server to process incoming requests, execute backend scripts (like PHP), query the database (MySQL), and assemble the HTML response.
Why Server Response Time Dictates SEO Success:
- The Downstream LCP Bottleneck: Largest Contentful Paint (LCP)—an explicit Google Core Web Vital ranking factor—measures how quickly the main visual element of a page renders. If your server takes 1.2 seconds just to deliver the first byte, your page is mathematically guaranteed to fail Google’s LCP threshold.
- Crawl Budget Optimization: Search engine crawlers have a finite time window to crawl your site. A responsive server allows Googlebot to download pages rapidly, speeding up indexation for new content.
- User Retention: Users browsing from mobile devices across competitive metropolitan regions expect instant response. A sluggish server leads to high bounce rates and lost conversions.
Google’s Official Server Response Benchmarks
According to Google’s web performance guidelines, server response thresholds are categorized as follows:
- Good: 0.8 seconds (800 ms) or less at the 75th percentile of user visits.
- Needs Improvement: Between 0.8 seconds and 1.8 seconds.
- Poor: Above 1.8 seconds.
Expert Tip: While Google accepts 800ms as “good,” elite web hosting environments running modern server stacks (like LiteSpeed or optimized Nginx) consistently achieve a TTFB well under 200 milliseconds.
Step-by-Step: How to Accurately Check Your Real Server Response Time
Testing server response time requires more than just typing your URL into a browser address bar. Local caching and network proximity can skew results. Use these professional testing methods to get an accurate reading:
1. Browser Developer Tools (The Quick Local Test)
You can inspect raw request timelines directly inside your browser:
- Open your website in Google Chrome or Microsoft Edge.
- Right-click anywhere on the page and select Inspect (or press
F12). - Navigate to the Network tab.
- Check the box labeled Disable cache to prevent local browser caching from faking your results.
- Refresh the page (
Ctrl + RorCmd + R). - Look at the top request entry (usually your domain name). In the waterfall chart or timing details panel, check the Waiting (TTFB) metric. This shows how long your browser waited for the server to respond.
2. GTmetrix (Comprehensive Global Auditing)
GTmetrix provides deep performance waterfalls that break down your server’s connection and waiting times.
- Enter your URL and select a testing server location closest to your target audience (e.g., testing from a US East or West Coast server if your audience is based in Texas, New York, or California).
- Review the Summary tab to check your initial document request’s TTFB.
3. WebPageTest.org (Advanced Multi-Location Testing)
WebPageTest is the gold standard for independent web performance analysis.
- It allows you to run multiple test runs, simulate specific mobile network speeds (e.g., 4G or 5G), and test from exact geographic data centers around the world.
- Look at the First Byte metric in the detailed performance results table.
4. Command-Line Testing via cURL (Pure Server Speed)
If you want to measure raw server response time without any browser rendering overhead, use the terminal command curl:
Bash
curl -o /dev/null -s -w "Connect: %{time_connect}TTFB: %{time_starttransfer}Total: %{time_total}\n" https://thehostreviews.com
This command queries your server directly and returns exact millisecond timings for connection setup, TTFB, and total request completion.
Why Is Your Server Response Time Slow? (Common Culprits)
If your tests reveal a sluggish TTFB (over 500ms), your hosting stack is suffering from one of these structural bottlenecks:
- Uncached Dynamic Processing: Forcing the server to compile PHP scripts and query databases from scratch for every single visitor.
- Resource Contention on Shared Hosting: Sharing CPU cores and RAM with heavy “noisy neighbor” websites on cheap shared hosting nodes.
- Outdated Server Software: Running legacy PHP versions (like PHP 7.4) that execute code significantly slower than modern releases.
- Physical Distance (Network Latency): Hosting your server files in Europe when your primary customer base resides in Texas, California, or New York.
- Bloated Database Queries: Accumulating thousands of unoptimized database tables, post revisions, and transient metadata.
Actionable Tips to Slash Your Server Response Time
You don’t necessarily need an expensive enterprise server upgrade to fix a slow TTFB. Implement these multi-layered optimizations:
1. Enable Server-Level Caching
Stop forcing your server to build pages dynamically. Implement full-page caching (such as LiteSpeed Cache or server-level Nginx FastCGI caching) to serve static HTML snapshots instantly.
2. Upgrade to Modern PHP (PHP 8.2 or 8.3)
Log into your hosting control panel, navigate to your PHP selector, and upgrade your runtime version. Modern PHP versions include advanced Just-In-Time (JIT) compilation that accelerates script execution times.
3. Implement Object Caching (Redis / Memcached)
Database retrieval adds heavy latency. Enable Redis or Memcached object caching to store frequently accessed database queries directly in server RAM.
4. Deploy a Global Content Delivery Network (CDN)
Physics dictates network latency. Integrating a global CDN (like Cloudflare) caches your content across hundreds of edge nodes worldwide, terminating user requests locally near hubs like San Francisco and New York.
Frequently Asked Questions (FAQ)
1. What is a good server response time (TTFB) for SEO?
Google considers a TTFB of 0.8 seconds (800 ms) or less to be good. However, high-performing websites aim for a TTFB under 200 milliseconds.
2. Why does my TTFB fluctuate during different times of the day?
Fluctuations are common on shared hosting plans where server resource contention spikes during peak traffic hours when neighboring websites experience heavy visitor traffic.
3. Does server location affect TTFB?
Yes. Physical distance introduces network latency. Hosting your website on a server close to your target audience minimizes the time data takes to travel across fiber-optic lines.
4. Can a caching plugin fix a slow server response time?
Yes, for repeat visitors, full-page caching bypasses database lookups and script execution entirely, dropping TTFB to fractions of a second.
5. How does TTFB impact Google Core Web Vitals?
TTFB is the foundational prerequisite for Largest Contentful Paint (LCP). A slow server response time directly causes a poor LCP score, harming your search rankings.
6. What is the difference between TTFB and total load time?
TTFB measures how long it takes for the browser to receive the first byte from the server. Total load time measures how long it takes for all assets (images, stylesheets, scripts) to finish downloading and rendering.
7. Why do online testing tools show different TTFB results?
Testing tools test from different global locations and simulated network conditions. Always test from a geographic server location close to your actual target audience.
8. How can I test my server response time without browser overhead?
You can use command-line tools like curl to ping your server directly and measure raw connection and transfer times without browser rendering interference.
9. Will switching from Apache to LiteSpeed improve my TTFB?
Generally, yes. LiteSpeed Web Server handles concurrent connections more efficiently and integrates natively with high-speed server-level caching plugins.
10. When should I upgrade my hosting plan due to slow TTFB?
If you have enabled full-page caching, optimized your database, upgraded your PHP version, and still record consistently high TTFB across multiple testing tools, your hosting hardware is underpowered and it is time to upgrade to a cloud or VPS plan.
Conclusion
Checking and optimizing your real web hosting server response time is a foundational requirement for modern digital success. By moving beyond marketing claims and using professional testing tools like browser developer tools, GTmetrix, WebPageTest, and command-line diagnostics, you gain complete visibility into your infrastructure’s health.
Whether you are managing a startup portfolio in Texas, an e-commerce platform in New York, or a tech blog in San Francisco, optimizing your TTFB ensures your website remains lightning-fast, highly responsive, and fully primed to secure top-tier visibility in Google search results.