

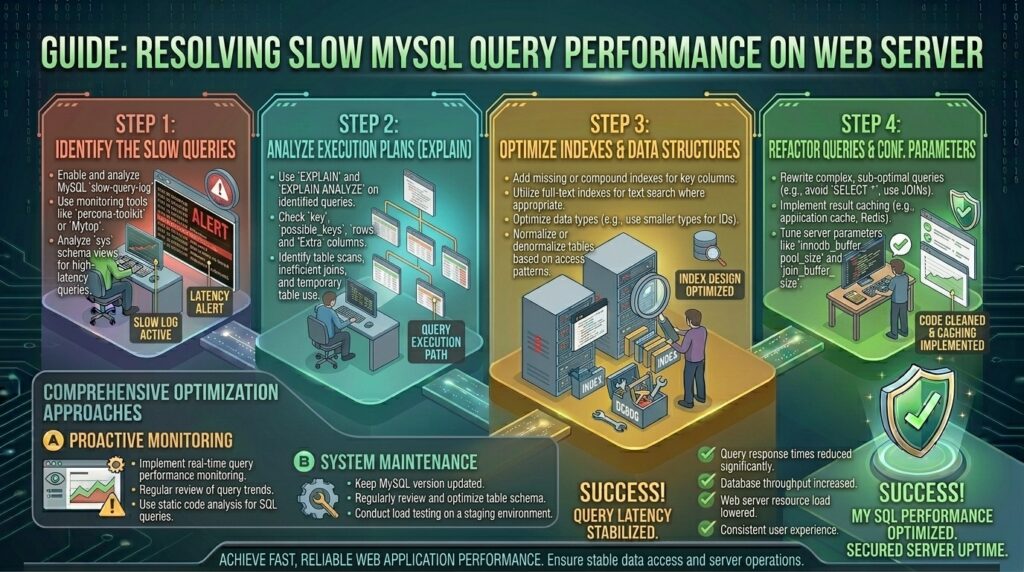
For developers, database administrators, and technical entrepreneurs managing high-performance web applications across major tech hubs like Texas, New York, California, Washington, and San Francisco, database responsiveness is the absolute heartbeat of user experience.
When your web server experiences latency, page load times crawl, API requests timeout, and CPU load averages spike into the danger zone. In more than 85% of these performance bottleneck scenarios, the root cause is not insufficient server RAM or slow CPU cores; it is slow MySQL or MariaDB query performance.
When poorly indexed tables, unoptimized joins, or massive unpaginated datasets hit your database engine simultaneously, your web server grinds to a halt. Resolving MySQL performance bottlenecks requires a disciplined, forensic approach—from enabling slow query logging and analyzing execution plans to tuning buffer pools and rewriting inefficient SQL code.
This comprehensive, highly detailed masterclass guide will walk you through diagnosing, troubleshooting, and permanently optimizing slow MySQL queries on your web server.
Understanding How MySQL Processes Queries Under the Hood
To fix database latency, you first need to understand how the MySQL query execution engine operates:
- Connection Handling: When your web application (such as WordPress, Magento, or a custom Node.js/Python API) needs data, it opens a TCP connection and sends a raw SQL string to MySQL.
- The Query Parser & Optimizer: MySQL parses the syntax, checks user permissions, and passes the query to the Query Optimizer. The optimizer calculates the most efficient execution plan—determining whether to use a secondary index or perform a full table scan.
- Storage Engine Execution (InnoDB): The query reaches the storage engine (typically InnoDB), which retrieves data pages from memory (the InnoDB Buffer Pool) or disk (NVMe storage).
- Result Set Return: MySQL formats the results and sends them back across the network to your web application.
If any step in this chain fails—such as a missing index forcing MySQL to read millions of disk rows for a single query—your web server resources are instantly exhausted.
Phase 1: Identifying and Logging Slow Queries
Never guess which query is slowing down your server. You must capture hard telemetry from the database engine itself.
1. Enabling the MySQL Slow Query Log
By default, MySQL does not log every query. You must explicitly configure the slow query log to capture queries that exceed a specific execution threshold (e.g., taking longer than 1 or 2 seconds).
- How to Enable Temporarily via MySQL Shell:SQL
SET GLOBAL slow_query_log = 'ON'; SET GLOBAL long_query_time = 1; -- logs queries taking longer than 1 second SET GLOBAL slow_query_log_file = '/var/log/mysql/mysql-slow.log'; - How to Enable Permanently: Edit your MySQL configuration file (
/etc/my.cnfor/etc/mysql/mariadb.conf.d/50-server.cnf) under the[mysqld]block:Ini, TOML[mysqld] slow_query_log = 1 slow_query_log_file = /var/log/mysql/mysql-slow.log long_query_time = 1 log_queries_not_using_indexes = 1Restart MySQL to apply changes:sudo systemctl restart mysql(ormariadb).
2. Analyzing the Slow Query Log
Once your log captures slow queries, you can review them manually or use powerful command-line analysis tools like Percona Toolkit (pt-query-digest) to summarize the most resource-intensive queries automatically:
Bash
pt-query-digest /var/log/mysql/mysql-slow.log
This utility outputs a detailed report breaking down queries by total execution time, row scan counts, and frequency, allowing you to target the most damaging database calls first.
Phase 2: Diagnosing Bottlenecks with EXPLAIN
Once you have isolated a slow query, you must examine how MySQL executes it using the EXPLAIN keyword.
1. Running an Explain Analysis
Prepend EXPLAIN to any SELECT query in your MySQL client terminal:
SQL
EXPLAIN SELECT * FROM wp_posts WHERE post_author = 5 AND post_status = 'publish';
2. Reading the EXPLAIN Output Table
Pay close attention to these critical columns in the output:
type(The Join Type): This is the most important metric.ALL(Worst): Full table scan. MySQL is reading every single row in the table from top to bottom.index: Full index scan (scans the index tree, slightly better thanALL).range: Index range scan (searches a specific range of an index).ref/eq_ref(Best): Uses a non-unique or unique index to look up exact rows instantly.
rows: Estimates how many rows MySQL must examine to execute the query. If a query withtype: ALLshows millions of rows, you have found your bottleneck.Extra: Look for phrases likeUsing filesortorUsing temporary, which indicate that MySQL had to allocate extra memory buffers to sort or group results because no index supported the operation.
Phase 3: Step-by-Step Fixes for Slow MySQL Performance
| Bottleneck Symptom | Root Cause | Recommended Solution |
Full Table Scans (type: ALL) | Missing indexes on WHERE or JOIN columns | Create strategic composite indexes |
Slow Pagination (LIMIT 100000, 20) | Deep offset scanning forces row traversal | Implement “Keyset / Seek” pagination |
High Disk I/O Wait (wa) | Inadequate memory caching | Tune innodb_buffer_pool_size |
| Unindexed Foreign Keys in Joins | Missing indexes on relational IDs | Index foreign key columns immediately |
1. Creating Strategic Indexes
If a query searches frequently by a column (such as user_id, status, or created_at) without an index, MySQL is forced to perform a slow full table scan.
- How to Fix: Add an index to the target column:SQL
CREATE INDEX idx_post_author_status ON wp_posts (post_author, post_status); - Rule of Thumb: Index columns that appear frequently in
WHERE,ORDER BY,GROUP BY, andJOIN ONclauses. Avoid over-indexing, as every index slows downINSERTandUPDATEoperations.
2. Fixing Slow Pagination Queries
Traditional database pagination using large offsets (e.g., SELECT * FROM products LIMIT 50000, 20) forces MySQL to read and discard 50,000 rows before returning the 20 requested records, causing severe latency.
- The Modern Fix (Seek Method / Keyset Pagination): Instead of using
OFFSET, paginate based on the last seen primary key value:SQLSELECT * FROM products WHERE id > 458920 ORDER BY id ASC LIMIT 20;This query jumps instantly to the exact index pointer, executing in milliseconds regardless of table size.
3. Tuning the InnoDB Buffer Pool (RAM Caching)
By default, MySQL’s memory configuration out-of-the-box is extremely conservative. If your InnoDB Buffer Pool is too small, MySQL reads data pages from physical disk drives rather than fast RAM.
- How to Tune: Open your
my.cnffile and allocate 50% to 70% of your total server RAM to the InnoDB buffer pool (assuming the server is dedicated primarily to MySQL):Ini, TOMLinnodb_buffer_pool_size = 4GThis ensures active tables and indexes remain cached directly in memory.
Phase 4: Advanced Database Optimization and Maintenance
Beyond tuning individual queries and indexes, long-term database performance requires proactive infrastructure maintenance.
1. Avoiding SELECT * Anti-Patterns
Writing queries like SELECT * FROM users forces the database to fetch every column, including heavy TEXT or BLOB fields that may not fit in memory, triggering expensive disk operations. Always explicitly declare only the specific columns you need (e.g., SELECT id, username, email FROM users).
2. Periodic Table Optimization and Defragmentation
Over time, heavy insert, update, and delete operations cause fragmentation in InnoDB tables, wasting disk space and reducing sequential read efficiency.
- Run table optimization periodically during off-peak hours:SQL
OPTIMIZE TABLE wp_posts;
Frequently Asked Questions (FAQ)
1. How do I know if my slow website is caused by MySQL or PHP?
You can use application performance monitoring (APM) tools, New Relic, or query logging. If web server logs show long execution times spent inside database drivers (mysqli_query or PDO execution), MySQL is the bottleneck.
2. Is it safe to enable the slow query log on a live production server?
Yes. Enabling slow_query_log introduces negligible overhead and is entirely safe for production environments. However, ensure your log files are rotated regularly so they do not fill up your disk quota.
3. What is the difference between a MyISAM and InnoDB storage engine?
InnoDB is the modern, ACID-compliant standard for MySQL, supporting row-level locking, foreign keys, and crash recovery. MyISAM uses table-level locking (which causes massive write bottlenecks) and should be avoided entirely.
4. Why does adding an index sometimes make a query slower?
While indexes drastically speed up SELECT (read) operations, they slow down INSERT, UPDATE, and DELETE (write) operations because MySQL must update the index tree every time data changes. Do not index every column blindly.
5. What is a “Full Table Scan” and why is it dangerous?
A full table scan occurs when MySQL reads every single row in a table to find matching results. On small tables with 100 rows, this takes microseconds. On large enterprise tables with 5,000,000 rows, it consumes 100% of CPU and disk I/O, freezing your server.
6. How do I check active running queries in real-time?
Log into your MySQL shell and execute:
SQL
SHOW FULL PROCESSLIST;
This lists every active query currently executing or waiting in line, allowing you to instantly spot locked tables or runaway processes.
7. Can I kill a stuck, slow-running MySQL query?
Yes. Run SHOW FULL PROCESSLIST; to find the ID of the stuck query, then execute:
SQL
KILL [query_id];
This immediately terminates the runaway query and frees up server resources.
8. How much RAM should I allocate to innodb_buffer_pool_size?
If your VPS or dedicated server is dedicated exclusively to database hosting, set innodb_buffer_pool_size to roughly 60% to 70% of your total physical RAM, leaving enough overhead for the operating system and connection threads.
9. Why does query performance degrade over time as tables grow?
As applications accumulate data, unindexed queries that once ran fast on 1,000 test rows slow down exponentially when tables expand to 1,000,000 rows. Regular index audits and table scaling are essential.
10. When should I migrate my database to a dedicated server?
If your web application has scaled to a point where your web server and MySQL database compete heavily for CPU and RAM resources on the same machine, it is time to separate them by moving MySQL to a dedicated high-performance database server.
Conclusion
Resolving slow MySQL query performance is critical for maintaining a lightning-fast, high-converting web application. By systematically enabling slow query logs, utilizing EXPLAIN execution plans to eliminate full table scans, creating targeted indexes, implementing keyset pagination, and tuning your InnoDB buffer pool, you can eliminate database bottlenecks entirely. Maintain proactive monitoring routines and follow these expert guidelines to ensure your database architecture operates at peak efficiency.