

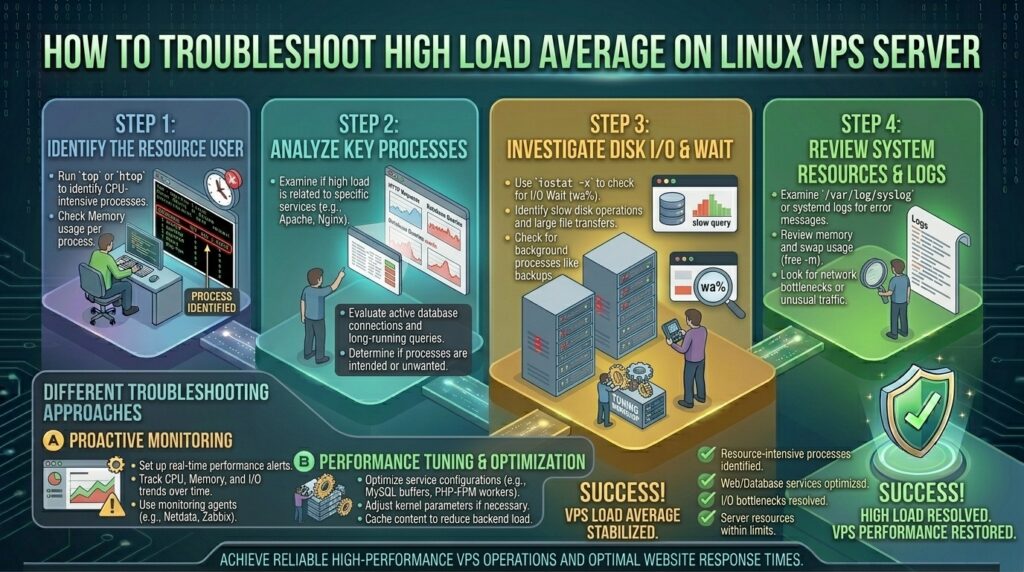
How to troubleshoot high load average on linux vps server? For system administrators, enterprise developers, and digital agency owners managing high-performance web infrastructure across major tech hubs like Texas, New York, California, Washington, and San Francisco, server stability is everything. When your virtual private server (VPS) experiences sudden traffic spikes, database bottlenecks, or runaway background scripts, response times crawl, services crash, and your revenue-generating web properties go offline.
One of the most reliable indicators of a struggling server is a spiking Load Average. When you log into your terminal and notice your load numbers climbing far past your CPU core count, it triggers immediate anxiety.
What does load average actually mean? Why is a high number dangerous? And how can you isolate the exact process choking your CPU, memory, or disk I/O?
This definitive, highly comprehensive troubleshooting guide will walk you through diagnosing, isolating, and permanently resolving high load average issues on a Linux VPS server.
Understanding Linux Load Average (Beyond the Numbers)
When system administrators talk about “load average,” they are referring to three distinct values displayed at the top of your terminal when running commands like uptime or top (e.g., load average: 2.45, 1.80, 0.95).
These three numbers represent the average system load over rolling time intervals:
- The First Number: Load average over the last 1 minute.
- The Second Number: Load average over the last 5 minutes.
- The Third Number: Load average over the last 15 minutes.
What Do These Numbers Actually Mean?
Unlike CPU utilization percentage (which measures how busy your processor is from 0% to 100%), load average measures the number of processes that are actively running on a CPU core or waiting in line for CPU, disk, or network resources.
- The Golden Rule of Cores: Load numbers are relative to your hardware. If your VPS has 2 CPU cores, a load average of
2.00means your processors are running at 100% capacity, perfectly utilized. If your load average climbs to6.00on a 2-core server, it means three times as many processes are demanding resources than your server has physical capacity to handle, resulting in severe queuing and latency.
Phase 1: Triage — Is Your High Load Caused by CPU, Memory, or Disk I/O?
A high load average does not automatically mean your CPU is maxed out. Linux treats processes waiting for slow hard drives or starved of memory the exact same way as processes waiting for CPU cycles.
Before diving into individual processes, you must determine which resource subsystem is bottlenecking your server.
1. Using top or htop for Real-Time Analysis
Connect to your VPS via SSH and run htop (or top if htop isn’t installed):
Bash
htop
Look at the top-left summary bars:
- CPU Usage: If user (
usr), system (sys), or wait (wa) bars are maxed out, you have a processing bottleneck. - Memory / Swap Usage: If physical RAM is 99% full and your Swap space is actively churning, your server is thrashing, causing load to skyrocket as it constantly reads and writes memory pages to disk.
- Disk Wait (
wa): If the CPU idle time is high, but thewa(I/O wait) percentage is spiking above 20%-40%, your processor is sitting idle waiting for slow disk drives (SSD/NVMe bottlenecks or database locking) to respond.
Phase 2: Isolating the Culprit Processes – How to troubleshoot high load average on linux vps server
Once you know which subsystem is suffering, you need to pinpoint the exact application, user, or process driving the load.
1. Finding CPU-Hogging Processes
To list the processes consuming the most CPU power in real-time, sorted automatically:
Bash
ps aux --sort=-%cpu | head -n 15
- Common Culprits: Uncached PHP workers (
php-fpm), runaway Apache/Nginx child processes, misconfigured cron scripts running infinite loops, or unindexed MySQL database queries.
2. Finding Memory-Hogging Processes
To list processes consuming the most RAM:
Bash
ps aux --sort=-%mem | head -n 15
- Common Culprits: Heavy Java or Node.js applications, bloated MySQL buffer pools, or aggressive WordPress WooCommerce background action schedulers.
3. Checking Disk I/O Bottlenecks with iotop
If your wa metric was high in htop, install and run iotop to see which specific process is thrashing your disk subsystem:
Bash
# Install iotop (Ubuntu/Debian)
sudo apt install iotop -y

# Run iotop
sudo iotop -o
This isolates the exact script or database process writing heavily to your storage drives.
Phase 3: Step-by-Step Fixes for Common VPS Load Spikes
| Root Cause of High Load | Diagnostic Indicator | Recommended Resolution |
| Runaway Database Queries | High MySQL/MariaDB CPU usage | Optimize slow queries, add indexes, or restart MySQL |
| Traffic Spike / DDoS Attack | Sudden surge in Nginx/Apache connections | Enable rate limiting, deploy Cloudflare WAF, block bad bots |
| PHP-FPM Worker Exhaustion | High memory/CPU usage by php-fpm | Tune pm.max_children and implement page caching |
| RAM Exhaustion & Swap Thrashing | Physical RAM full, Swap active | Add swap space, optimize MySQL innodb_buffer_pool_size |
1. Taming Runaway MySQL / MariaDB Databases
Database queries are the number one cause of high load averages on web hosting servers. If an unoptimized plugin or a heavy search query locks up MySQL, all web requests queue up, sending the load average through the roof.
- Diagnose Slow Queries: Log into MySQL and check current running processes:SQL
SHOW FULL PROCESSLIST; - Quick Relief: If a runaway query or locked table is freezing your server, you can kill the specific query ID:SQL
KILL [process_id]; - Long-Term Fix: Enable the MySQL Slow Query Log (
slow_query_log = 1) in your/etc/my.cnfconfiguration to track and rewrite inefficient database queries.
2. Optimizing PHP-FPM Configuration
If you run modern LEMP or LAMP stacks, misconfigured PHP-FPM worker pools can easily overwhelm a server. If pm.max_children is set too high, PHP will spawn more processes than your RAM can handle, triggering swap thrashing.
- How to Tune: Open your PHP-FPM pool configuration file (e.g.,
/etc/php/8.3/fpm/pool.d/www.conf) and adjust worker settings based on your available RAM, ensuring your server never spawns more processes than physical memory allows.
3. Implementing Aggressive Caching
If your server load spikes every time traffic increases, your web application is compiling dynamic PHP code and querying the database for every single page view.
- Action Plan: Implement server-level object caching (like Redis or Memcached) and full-page caching (like LiteSpeed Cache, Nginx FastCGI caching, or Varnish). This reduces CPU utilization by up to 90% by serving static cached pages instantly.
Phase 4: Advanced Server Monitoring & Prevention
Reacting to high load averages after your server crashes is reactive and stressful. Proactive monitoring ensures you catch resource creep before it impacts users.
1. Setting Up Automated Load Alerts
Install lightweight monitoring utilities like netdata or configure server monitoring agents provided by your cloud hosting provider (such as DigitalOcean monitoring, AWS CloudWatch, or Linode longview). Set up email or Slack alerts to trigger if your 15-minute load average exceeds your core count for more than 10 consecutive minutes.
2. Scaling Your Infrastructure (Vertical vs. Horizontal)
If your website traffic has genuinely grown across your customer bases in New York, Texas, and California, software optimizations will only take you so far:
- Vertical Scaling: Upgrade your VPS plan to a higher tier with more CPU cores and RAM.
- Horizontal Scaling: Separate your services—move your MySQL database to a dedicated database server or offload static media assets to an external CDN (Content Delivery Network).
Frequently Asked Questions (FAQ)
1. What is considered a “danger zone” load average for a VPS?
As a general rule of thumb, if your 1-minute and 5-minute load averages consistently exceed 2.0 times your total number of CPU cores (e.g., a load of 8+ on a 4-core server), your server is severely overloaded, and users will experience significant lag or timeout errors.
2. Can a high load average occur even when CPU usage is low?
Yes. If your server runs out of RAM and starts swapping to disk, or if your applications are waiting for slow disk I/O operations (wa), processes will pile up in the kernel run queue, causing a massive load average while CPU usage remains low.
3. How do I find out how many CPU cores my VPS has?
You can instantly check your server’s core count by running this command in your terminal:
Bash
nproc
Alternatively, view detailed processor specifications by typing lscpu.
4. What is the difference between CPU utilization and load average?
CPU utilization measures the percentage of time processors spend actively working (e.g., 85% busy). Load average measures the quantity of processes waiting for execution or resources over time.
5. Can a botnet or DDoS attack cause a high load average?
Yes. A flood of malicious HTTP requests hitting your web server simultaneously will exhaust your Nginx/Apache worker threads, spike CPU usage, and cause the load average to skyrocket.
6. Why does my load average spike briefly and then drop back down?
Occasional short-term load spikes (e.g., a cron job running a nightly database backup or a surge of traffic) are normal. You only need to investigate if the high load persists across the 5-minute and 15-minute averages.
7. How do I restart services when the server load is too high to log in?
If the server is so overloaded that SSH connections time out, you must log into your hosting provider’s web dashboard (cPanel, VNC, or cloud provider console) and use their emergency hardware restart or web terminal.
8. Does restarting Apache/Nginx or MySQL fix high load?
Restarting services can provide immediate temporary relief by clearing stuck processes and freeing up memory leaks, but it is only a band-aid. You must investigate error logs to fix the underlying trigger.
9. Can an outdated Linux kernel cause high resource usage?
While rare, severe bugs in outdated kernel versions can lead to memory leaks or inefficient scheduler queuing. Keeping your operating system updated via sudo apt update && sudo apt upgrade is essential.
10. When should I upgrade my VPS hardware plan?
If you have optimized your database queries, enabled aggressive caching, tuned your PHP-FPM workers, and your server still runs at maximum capacity during normal business hours, it is time to vertically scale your VPS to a higher CPU and RAM tier.
Conclusion
Encountering a high load average on your Linux VPS can throw your digital operations into chaos, but diagnosing the bottleneck doesn’t have to be guesswork. By systematically utilizing tools like htop, iotop, and ps to separate CPU, memory, and disk I/O bottlenecks, and applying targeted fixes like database optimization, caching layers, and worker tuning, you can restore peak performance. Maintain proactive monitoring routines and follow these expert guidelines to ensure your web infrastructure stays fast, resilient, and ready for scale.



Pingback: How to fix database connection timed out error on vps - The host reviews