

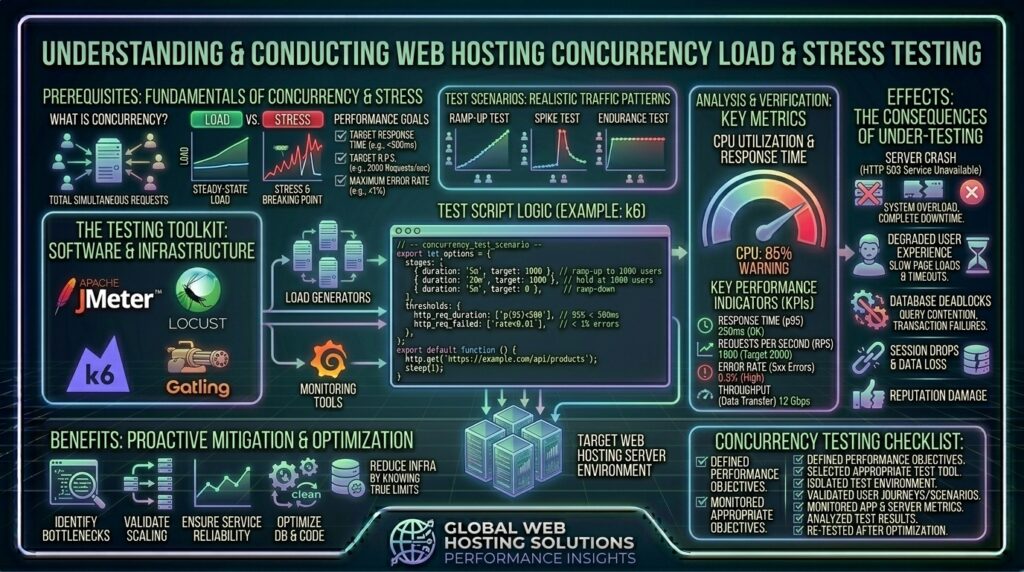
How to Test Web Hosting Server Concurrency Under Load Stress: The Complete Engineering Performance Guide
Welcome to thehostreviews.com—your premier authoritative destination for web hosting stress testing, server concurrency benchmarking, and cloud infrastructure performance reviews spanning major tech hubs from New York and San Francisco to Texas, California, and Washington.
Introduction: The Illusion of Performance in a Lab Environment
Every web developer, system administrator, and business owner has experienced this nightmare scenario: You launch a newly designed website, run a quick, single-user performance audit in your browser, and watch the page load in under 0.8 seconds. You pat yourself on the back, confident that your hosting infrastructure is rock-solid.
Then, your latest marketing campaign launches, a major product drops, or your brand is featured on a high-traffic news portal. Suddenly, thousands of concurrent users flood your server simultaneously. Your database locks up, PHP workers exhaust their memory limits, and your server grinds to a complete halt.
Why did your server pass local tests with flying colors only to crash under real-world pressure? The answer lies in Concurrency and Load Stress.
Evaluating how your web hosting environment handles a single user tells you almost nothing about how it will behave when 500, 5,000, or 50,000 visitors hit your application at the exact same millisecond. To uncover hidden bottlenecks before your users do, you must master the art of server load testing.
This comprehensive, expert-level masterclass will walk you through the architecture of server concurrency, the key performance metrics you must measure, step-by-step stress testing procedures using industry-standard tools, and proven strategies to bulletproof your hosting environment.
Part 1: Deconstructing Concurrency vs. Throughput
Before firing stress-testing tools at your web server, it is vital to define the fundamental performance terminologies that govern server engineering.
1. What is Concurrency?
Concurrency refers to the number of distinct requests or user sessions your web server is handling at the exact same moment in time.
- If 300 visitors are actively browsing your website, clicking links, submitting forms, or checking out carts simultaneously, your server is managing a concurrency load of 300 users.
2. What is Throughput?
Throughput measures the volume of work your server can successfully process over a specific period—typically expressed as Requests Per Second (RPS) or megabytes transferred per second.
- High concurrency does not automatically guarantee high throughput. If your server is bogged down by unoptimized database queries, high concurrency will cause throughput to plummet and latency to skyrocket.
3. The Bottleneck Hierarchy in Web Hosting
When a server buckles under load stress, failure typically traces back to one of four foundational layers:
- Network I/O & Firewall Limits: The server’s network interface card (NIC) or cloud provider port gets saturated, or DDoS protection filters drop incoming TCP packets.
- Web Server Worker Limits (Nginx/Apache): The maximum number of concurrent worker processes (
worker_connectionsin Nginx orMaxClientsin Apache) is reached, placing subsequent connection requests into a holding queue. - Application Processor Limits (PHP-FPM): PHP-FPM runs out of active child processes (
pm.max_children), forcing new requests to wait or time out. - Database Connection Pools: MySQL or PostgreSQL exhausts its maximum allowable connections (
max_connections), throwing fatal database connection errors.
Part 2: Essential Metrics to Monitor During Load Testing
Running a stress test without monitoring server metrics is like flying an airplane blindfolded. As you hammer your staging environment with simulated traffic, you must track five critical performance indicators in real time:
- Time-to-First-Byte (TTFB): How long does the server take to send the very first byte of data back to the user? Under heavy load, a healthy TTFB should remain under 200ms to 400ms.
- Requests Per Second (RPS): The total number of successful HTTP requests your server can process per second before degradation begins.
- Error Rate Percentage: The ratio of failed responses (HTTP 500, 502, 504, or connection timeouts) relative to successful HTTP 200 OK responses. A production-grade site should maintain a 0% error rate under normal peak loads.
- CPU and Memory Utilization: Tracking real-time RAM and CPU consumption via Linux monitoring utilities (
htop,dstat) to see which resource saturates first. - p95 and p99 Latency Percentiles: Instead of looking only at average response time, look at p95 (the response time experienced by the slowest 5% of users) to catch hidden latency spikes.
Part 3: Step-by-Step Guide — Testing Concurrency with Industry-Standard Tools
There are several powerful, open-source benchmarking tools used by DevOps engineers to simulate high-concurrency traffic loads. Below are step-by-step guides for executing tests with Apache Bench (ab), k6, and Locust.
Method 1: Quick Baseline Stress Testing with Apache Bench (ab)
Apache Bench is a lightweight, pre-installed command-line utility found on most Linux systems. It is ideal for quick sanity checks and measuring raw static file throughput.
- Connect to a remote testing terminal (do not run heavy stress tests from your local laptop to avoid local network interference).
- Execute a test simulating 500 total requests with a concurrency level of 50 simultaneous users:Bash
ab -n 500 -c 50 https://staging.thehostreviews.com/-n 500: Total number of requests to perform during the test.-c 50: Number of multiple requests to make at a time (concurrency level).
- Analyze the output metrics:
- Requests per second: Look at how many requests your server handled per second.
- Time per request: Check both the mean and across concurrent settings.
- Failed requests: Ensure this number is zero. If Apache Bench reports socket connection errors or timeouts, your server’s connection queue is dropping packets.
Method 2: Advanced Scenario Testing with Grafana k6
For modern web applications, APIs, and WordPress sites, k6 (built on Go and JavaScript) is the gold standard for load testing. It allows you to simulate complex user behaviors (like logging in, adding items to a cart, and browsing pages).
- Install k6 on your testing machine (Ubuntu/Debian):Bash
sudo gpg -k sudo gpg --no-default-keyring --keyring /usr/share/keyrings/k6-archive-keyring.gpg --keyserver hkp://keyserver.ubuntu.com:80 --recv-keys C5AD17C047C0FA5A echo "deb [signed-by=/usr/share/keyrings/k6-archive-keyring.gpg] https://dl.k6.io/deb stable main" | sudo tee /etc/apt/sources.list.d/k6.list sudo apt update && sudo apt install k6 -y - Create a test script named
load-test.js:JavaScriptimport http from 'k6/http'; import { check, sleep } from 'k6'; export const options = { stages: [ { duration: '30s', target: 50 }, // Ramp up to 50 concurrent users over 30 seconds { duration: '1m', target: 200 }, // Spike and hold at 200 concurrent users for 1 minute { duration: '30s', target: 0 }, // Ramp down to 0 users ], }; export default function () { const res = http.get('https://staging.thehostreviews.com/'); check(res, { 'status is 200': (r) => r.status === 200, 'response time < 500ms': (r) => r.timings.duration < 500, }); sleep(1); } - Execute your k6 stress test:Bash
k6 run load-test.js - Review the real-time terminal output, paying close attention to check failures and HTTP request durations.
Method 3: Distributed Python Load Testing with Locust
If you want to simulate thousands of users clicking through multiple pages simultaneously using Python code, Locust is an exceptional distributed load-testing framework.
- Install Locust via pip:Bash
pip install locust - Create a test file named
locustfile.py:Pythonfrom locust import HttpUser, task, between class WebsiteUser(HttpUser): wait_time = between(1, 2.5) @task(3) def view_homepage(self): self.client.get("/") @task(1) def view_blog_post(self): self.client.get("/sample-performance-review/") - Run Locust and launch its web-based dashboard:Bash
locust -f locustfile.py - Open
http://localhost:8089in your browser, input your target user count and hatch rate, and watch real-time graphs track your server’s concurrency limits.
Part 4: Step-by-Step Guide — Monitoring Server Resources via SSH
While running your load test using k6 or Locust, open a separate SSH terminal session into your target web server and run real-time monitoring tools to identify hardware bottlenecks:
- Monitor CPU, RAM, and Processes with
htop:BashhtopWatch the CPU core bars. If all cores hit 100% utilization while concurrency climbs, your server’s CPU is the primary bottleneck. - Monitor Network Sockets and Connections with
ssornetstat:Bashss -sChecks active TCP socket connections. If your server hits its maximum open file descriptor or socket limit, incoming connections will be dropped abruptly. - Monitor Disk I/O with
iostatordstat:Bashdstat -c -m -d 1Tracks CPU, memory, and disk read/write throughput in real time. If disk wait times (await) spike, your database is hammering disk storage due to unindexed queries or lack of RAM caching.
Part 5: Proven Optimization Tips to Boost Server Concurrency
If your stress test reveals that your server crashes or slows down under concurrency, apply these engineering optimizations to multiply your throughput:
- Implement Object Caching (Redis / Memcached): Offload database query caching away from standard PHP execution by deploying a persistent object cache. This reduces database load by up to 90%.
- Tune PHP-FPM Process Management: Avoid default dynamic PHP-FPM settings. Calculate your available RAM and adjust
pm.max_children,pm.start_servers, andpm.min_spare_serversto handle concurrent traffic spikes without spawning more workers than your RAM can support. - Configure Web Server Worker Limits: Increase Nginx worker connections and worker processes (
worker_connections 1024; worker_processes auto;) to allow thousands of simultaneous non-blocking connections. - Deploy a Global CDN & Edge Caching: Never let static assets (images, CSS, JS) hit your origin server during a concurrency test. Route all static traffic through Cloudflare or BunnyCDN edge nodes.
Part 6: Frequently Asked Questions (FAQ)
1. What is server concurrency in web hosting?
Server concurrency is the number of distinct user requests or sessions that your web hosting server can process simultaneously at any given millisecond.
2. Why is single-user testing misleading for website performance?
Single-user tests do not account for resource contention. A server can easily load a page for one user in 0.5 seconds, but when 500 users request data simultaneously, CPU, database, and memory bottlenecks emerge.
3. What tools are best for testing server load stress?
Industry-standard tools include k6 (for modern scenario-based scripting), Locust (for Python-based distributed testing), and Apache Bench (ab) for quick baseline throughput checks.
4. What is a “good” Requests Per Second (RPS) score?
RPS varies entirely based on your application. A static HTML site might handle 5,000 RPS on a modest VPS, whereas a heavy, unoptimized WooCommerce database checkout flow might bottleneck at 15 RPS.
5. Should I run stress tests on a live production website?
Never. Stress testing floods your server with artificial traffic designed to push resources to their absolute breaking point. Always run load tests on an isolated staging environment that mirrors production hardware.
6. What does a high HTTP error rate indicate during a load test?
A high error rate (such as 502 Bad Gateway or 504 Gateway Timeouts) indicates that your web server, PHP-FPM, or database backend has crashed or exceeded its connection queue limits.
7. How do I know if my CPU or RAM is the primary bottleneck?
You can track real-time resource utilization by running htop in your server’s SSH terminal while your load test is actively executing.
8. What is the difference between latency and throughput?
Latency measures how long a single request takes to complete (delay), whereas throughput measures the total volume of requests processed successfully per second.
9. How does object caching improve concurrency?
Object caching stores the results of complex database queries in fast RAM (via Redis or Memcached), allowing subsequent concurrent requests to bypass heavy database computations instantly.
10. Can shared hosting handle high concurrency stress tests?
No. Budget shared hosting plans enforce strict resource caps and noisy-neighbor limits. High-concurrency stress tests will quickly trigger account throttling or server blocks on shared hosting.
Conclusion
Testing your web hosting server concurrency under load stress is the ultimate litmus test for digital resilience. By moving away from superficial local speed checks, utilizing advanced benchmarking tools like k6 and Locust, monitoring real-time system metrics, and optimizing your PHP, web server, and database layers, you ensure your infrastructure stands strong when traffic surges.